The Zürich Soundscape Map
Status: coming soon
The map is generated from anonymised participant data using a Python/Folium pipeline and will be embedded on this page once enough data has been collected and validated. Nothing on this page is interactive yet — see the feasibility note at the end of this page for how that will work.
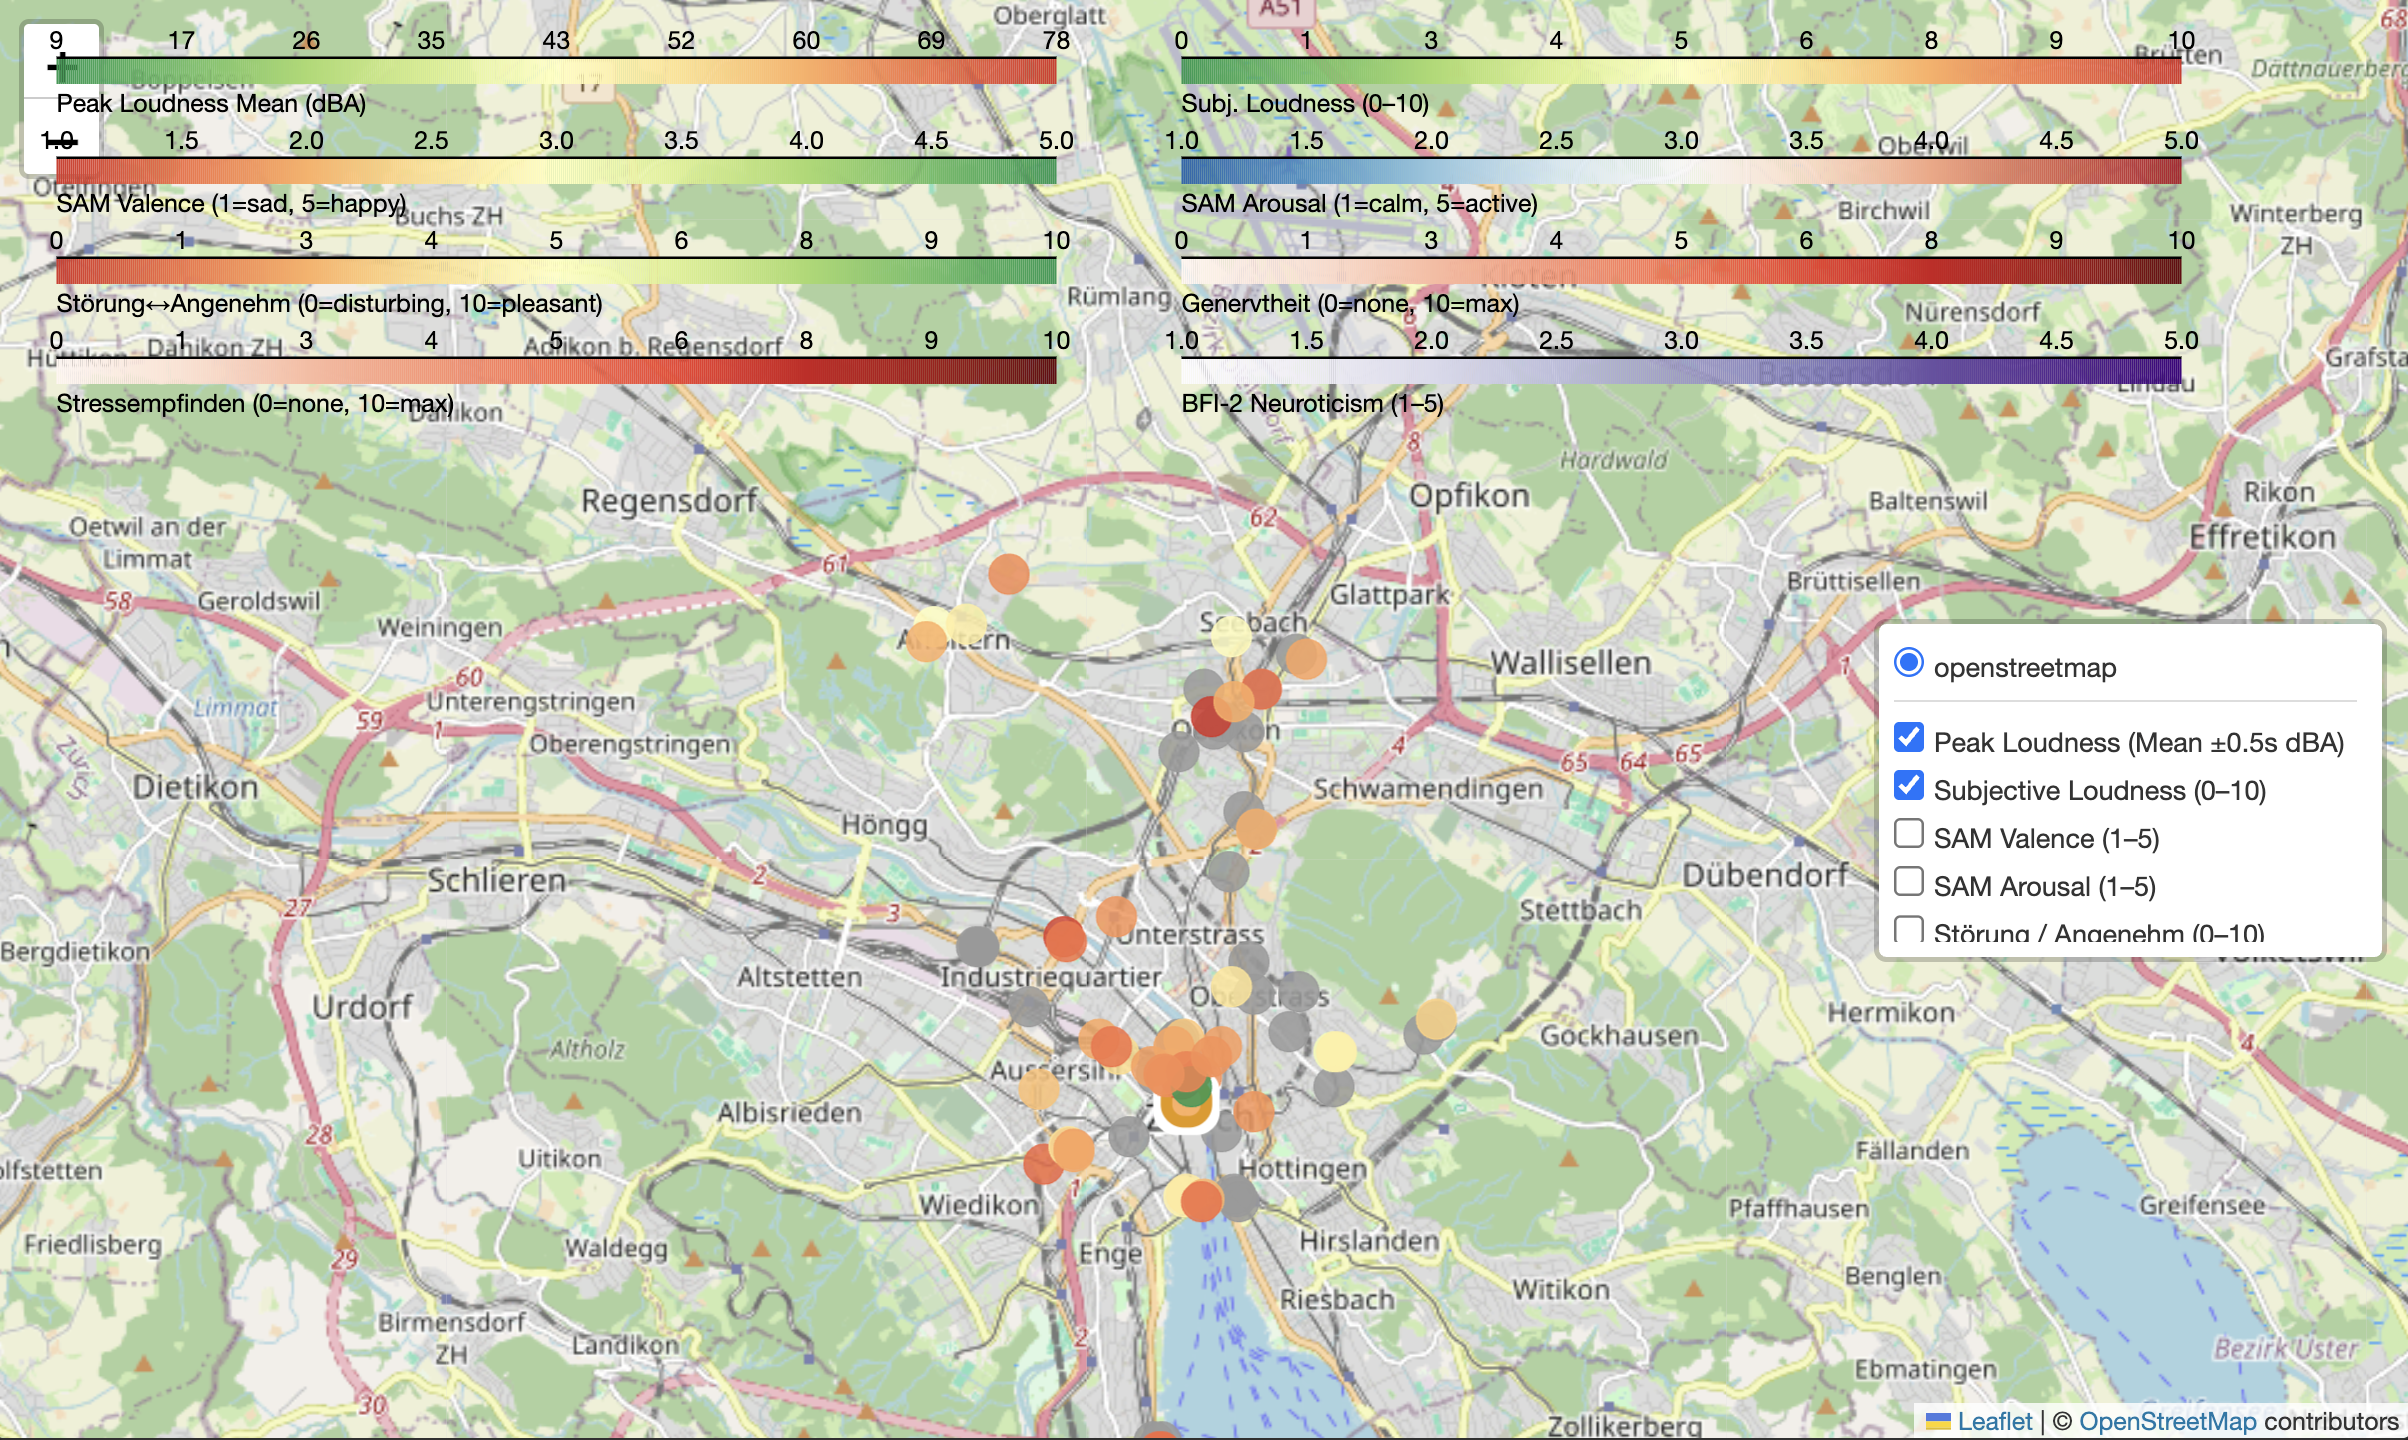
Planned map layers
The map is designed to combine objective measurements with subjective, in-the-moment ratings across nine layers:
| Layer | What it shows | Scale |
|---|---|---|
| Peak loudness (objective) | Measured peak sound level around each recording | Continuous, red = loud |
| Subjective loudness | How loud the participant felt the location was | 0–10 |
| SAM valence | Self-Assessment Manikin: how pleasant the moment felt | 1–5 |
| SAM arousal | Self-Assessment Manikin: how activating/calming the moment felt | 1–5 |
| Disturbance / pleasantness | Whether the location felt disturbing or pleasant | 0–10 |
| Location type | Noise hotspot, neutral place, or quiet zone | Category |
| Annoyance | Reported annoyance at the location | 0–10 |
| Perceived stress | Reported stress at the location | 0–10 |
| Neuroticism (BFI-2) | Participant trait neuroticism, for context | 1–5 |
Only one layer is shown by default; the others can be toggled on and off. Locations with missing data for a given layer are shown in grey.
Data & privacy on the map
The public map will only ever show pseudonymised, aggregated data — no names, no raw audio, and no information that could identify a participant. See our data protection statement for details.